| ID: 1-50 Name: zca Initial conditions: V -71.81327 hhs 0.98786 nns 0.02457 bbs 0.203517 zzs 0.00141 s_AMPA 0 Associated Variable Values: C_m 1 I_app 0.661914 V_K -90 V_L -70 V_Na 55 g_A 1.4 g_Kdr 6 g_L 0.05 g_Na 35 g_NaP 0.3 g_Z 1 g_syn 1 phi 10 pms 3 pns 4 sigma_a 20 sigma_b -6 sigma_h -7 sigma_k 7 sigma_m 9.5 sigma_n 10 sigma_p 3 sigma_s -2 sigma_z 5 tau_Bs 15 tau_Zs 75 tau_h -40.5 tau_n -27 tau_s 15 theta_a -50 theta_b -80 theta_h -45 theta_m -30 theta_n -35 theta_p -47 theta_s -10 theta_z -39 # Connection Parameters # function values Ainfs_val 0 I_A_val 0 I_Kdr_val 0 I_NaP_val 0 I_Na_val 0 I_appx_val 0 I_syn_val 0 I_z_val 0 Minfs_val 0 Pinfs_val 0 s_inf_val 0 |
| Network zca.net Dt 0.05 Print Step Size 1 Output V hhs nns bbs zzs s_AMPA Method: rk4 Setup Seed 1 Simulation Seed 1 Alias none Experiment control 0 Change V = gauss(-70.0, 5.0) |
| Number
of Types: 1 For zca Number: 50 Inbound Connections: name ave std min max Excitatory 0 0 0 0 Inbound Connections Latency: name ave std min max Excitatory 0 0 0 0 Outbound Connections: name ave std min max Excitatory 0 0 0 0 Outbound Connections Latency: name ave std min max Excitatory 0 0 0 0 State Variables: name ave std min max V -69.22128462 4.634382155 -77.81695028 -60.19585855 hhs 0.98786 0 0.98786 0.98786 nns 0.02457 6.58544508e-10 0.02457 0.02457 bbs 0.203517 5.268356064e-09 0.203517 0.203517 zzs 0.00141 0 0.00141 0.00141 s_AMPA 0 0 0 0 |
| Network
zca.net
Dt 0.05 Print Step Size 1 Method: rk4 Setup Seed 1 Simulation Seed 1 Alias none Output V # We just output the V for each of the 50 neurons to save disk space Raster: V 7.0 # Generate a raster diagram using the V to determine when a change >7 mV occurs Experiment control 1 Change V = gauss(-70.0, 5.0) |
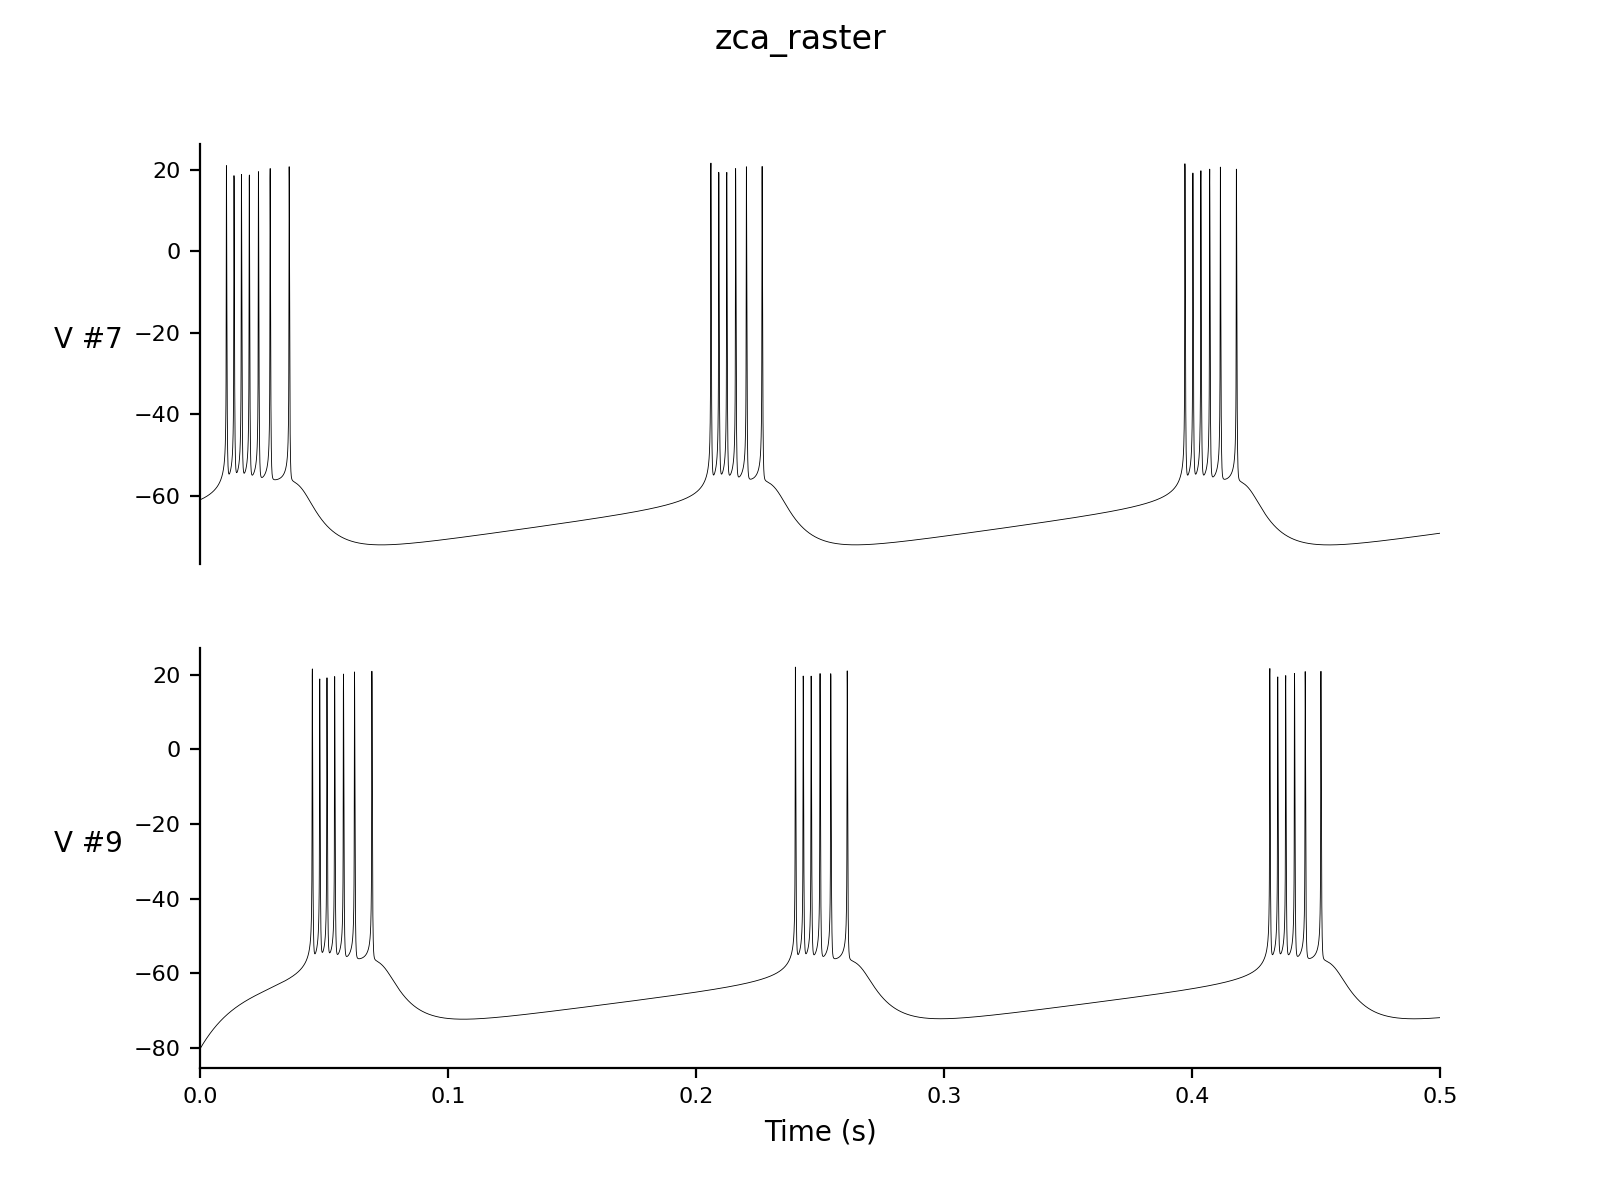
| > nne_plotPair
zca_raster.setup 7 9 |
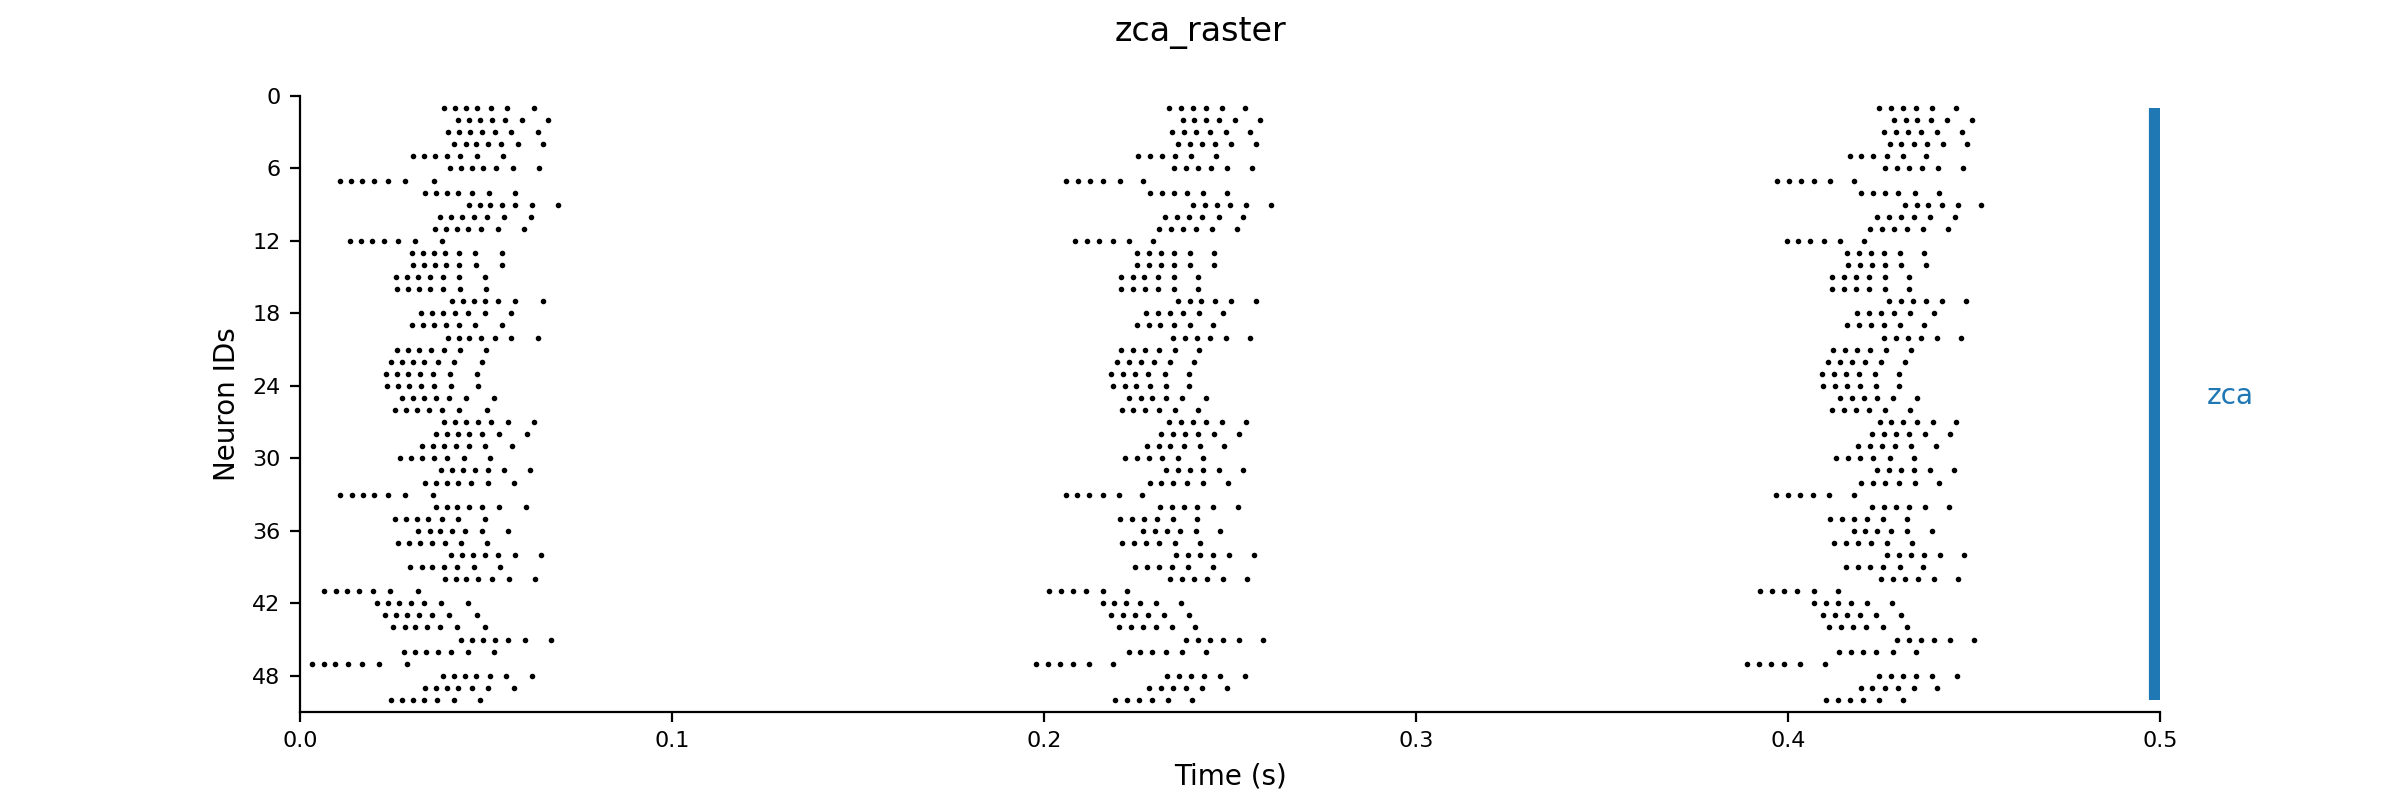
| >
nne_plotRaster zca_raster.setup |
| ID:
1-50 Name: zca Excitatory Connections To: (1-50,0.0,"randRand50-5-directed2.txt") Initial conditions: V -71.81327 hhs 0.98786 nns 0.02457 bbs 0.203517 zzs 0.00141 s_AMPA 0 Associated Variable Values: C_m 1 I_app 0.661914 V_K -90 V_L -70 V_Na 55 g_A 1.4 g_Kdr 6 g_L 0.05 g_Na 35 g_NaP 0.3 g_Z 1 g_syn 1 phi 10 pms 3 pns 4 sigma_a 20 sigma_b -6 sigma_h -7 sigma_k 7 sigma_m 9.5 sigma_n 10 sigma_p 3 sigma_s -2 sigma_z 5 tau_Bs 15 tau_Zs 75 tau_h -40.5 tau_n -27 tau_s 15 theta_a -50 theta_b -80 theta_h -45 theta_m -30 theta_n -35 theta_p -47 theta_s -10 theta_z -39 # Connection Parameters # function values Ainfs_val 0 I_A_val 0 I_Kdr_val 0 I_NaP_val 0 I_Na_val 0 I_appx_val 0 I_syn_val 0 I_z_val 0 Minfs_val 0 Pinfs_val 0 s_inf_val 0 |
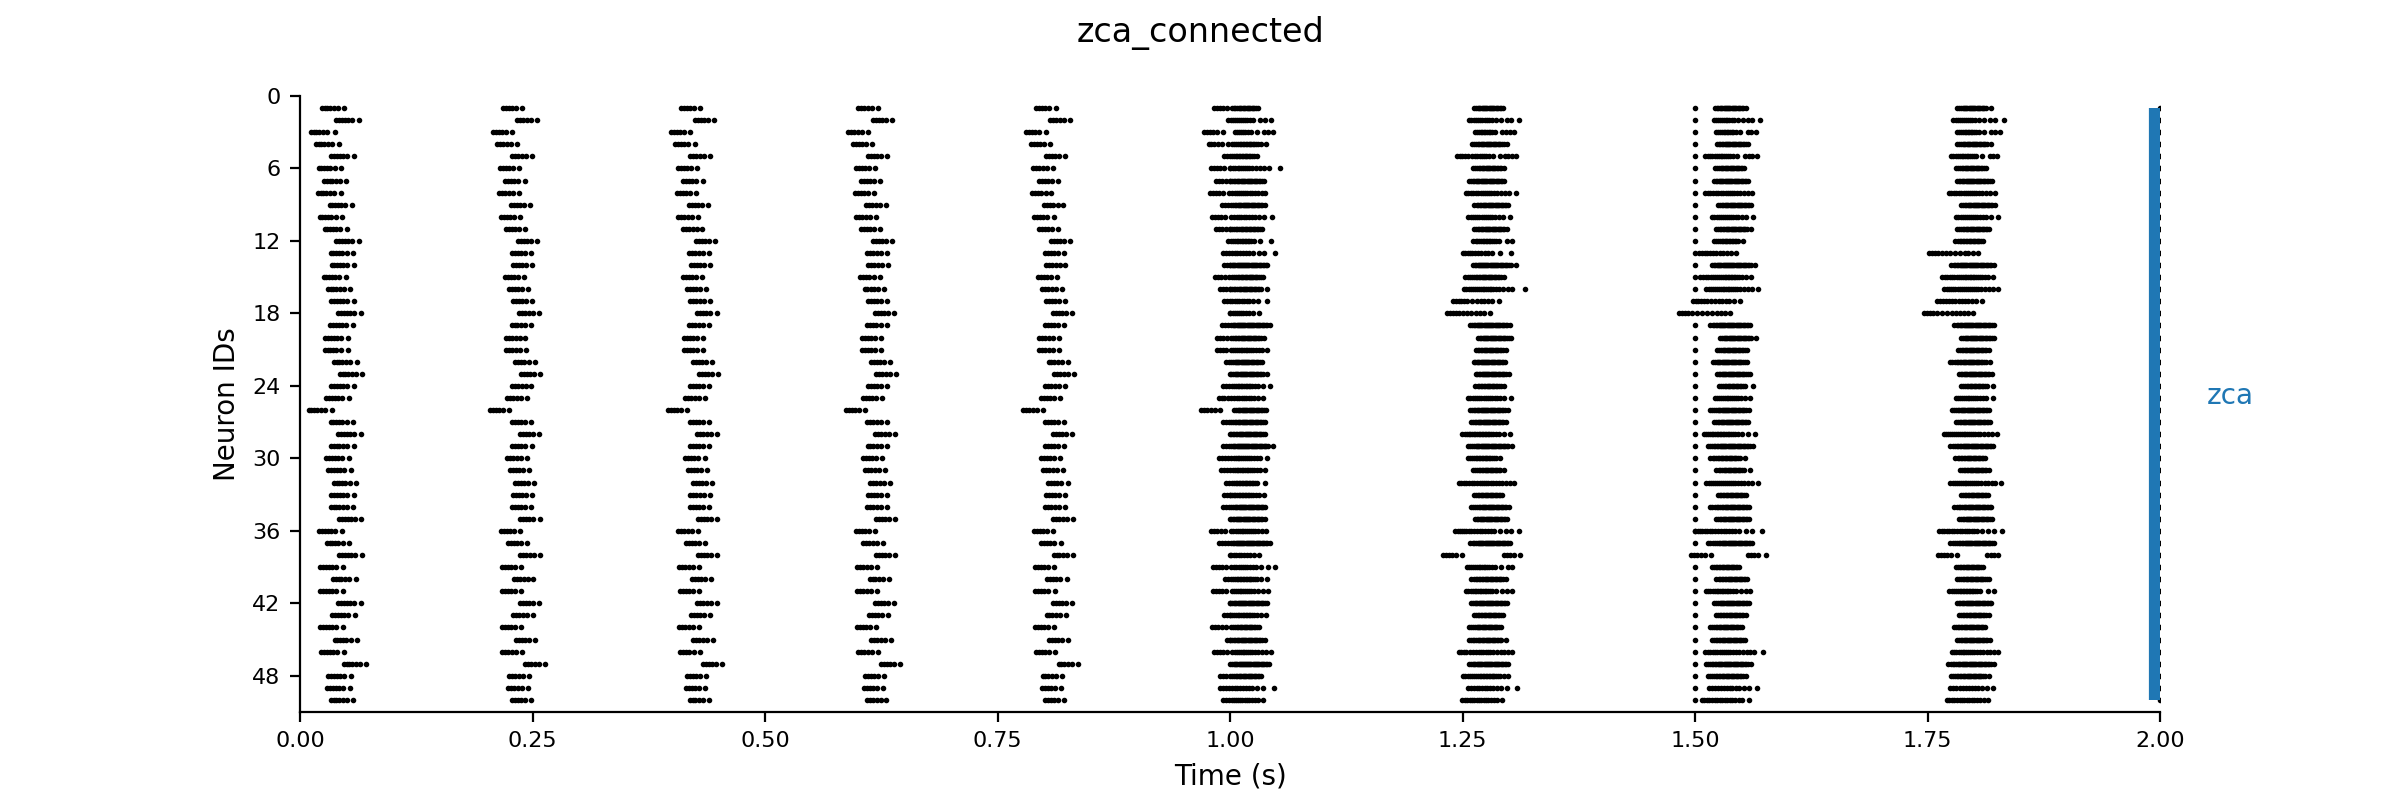
| Network
zca_connected.net
Dt 0.05 Print Step Size 1 Output V Raster: V 7.0 Experiment unconnected 2 control 2 Change V = gauss(-70.0, 5.0) Change g_syn /= 5.0 |
| Time:
500
Changes g_syn = 0 |